
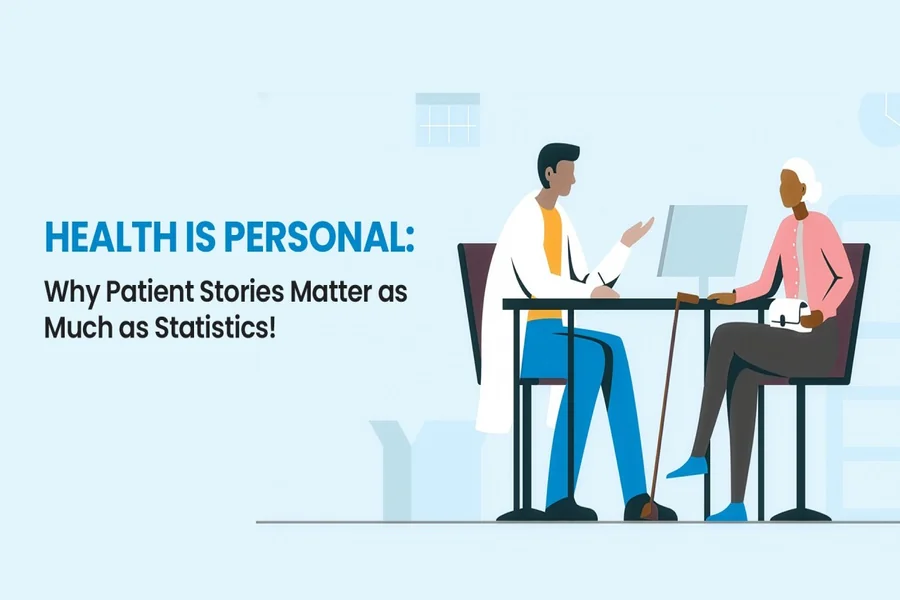
Personal storytelling is more persuasive than data – and why, and how, it can affect our interpretation of data in the age of cognitive bias, emotion, and hyper-computing. A statement like “one in a thousand” tells you about the event that happens to one person out of 1000. You can feel like that one person is sitting next to you telling you exactly what went on in the story. All of a sudden, the number isn’t so abstract—and, at times, feels more believable than it should.
This disconnect between statistical evidence and personal experience offers a first-hand lesson in human decision-making. Not all information we take in is reduced to a calculation in our brain.
Suppose something strange happens, but the odds are extremely small. The information is clear, but it doesn’t carry much significance. You then watch a short video of a person sharing their experience of what happened to their life because of that. It’s the same numbers but a different perspective!
Personal stories are a sense of personal experience. They breathe life into statistics, give them a voice, and put them in a string of events. We make an imaginary person experience a familiar situation rather than focus on a group of people.
This relates to the identifiable victim effect. When it comes to feeling one’s suffering or success, it’s often more effective to receive information about a bigger group than the individual. In seconds, one story can elicit empathy, curiosity, and feeling for a situation.
Examines the Neuroscience of Narrative Bias
When the brain comes across something that resonates, it prioritizes it. Emotional salience drives attention, while memory systems help us hold on to salient events.
A personal narrative offers several benefits compared to a table of numbers. Has characters, a start, a turn, and an end. This structure makes the information easier to imagine and recall.
This is a large part of what’s known as the availability heuristic. Deduced probabilities or significance of events are, at least in part, based on the ease with which instances of the event come to mind. If a dramatic story comes to mind, the event it describes may seem more familiar than the statistics indicate.
Think about an individual who has achieved an outstanding accomplishment in a competitive digital world. The narrative could be shared on social media, commented on, and remembered long after data on certain issues is irrelevant. The brain does not always ask, “How representative is this example of?” It could just be, “That was something I remember very well.”
The Power of a Good Story and Esports Markets.
This is particularly fascinating in esports markets where narratives and statistics can be related.
With a dramatic comeback, an unexpected player performance, or a team suddenly surging in form, a lot of attention is drawn. The saga of this emotional event can be recalled long after the sample sizes, historical averages, and winning percentages are forgotten.
We’ve seen this pattern in competitive digital environments before. A single outstanding event can overshadow the bigger picture in longer-term data.
Why Emotional Stories Can Distort Judgment
Experience is a valuable guide to probability, but not always. A statistic may be a description of thousands of observations; a personal account may be a description of one. The first sets up a pattern; the second provides some insight into the “feel” of that pattern.
This is an area of interest for behavioral economics. Individuals aren’t just computation machines. They make decisions more quickly using mental shortcuts, especially when they are having trouble keeping up with information or dealing with decision fatigue.
In digital contexts, these shortcuts matter even more. You can use these vivid features in a single testimonial. The effect is potent: feelings and numbers, even when the numbers need more nuanced interpretation.
Digital engagement: Where stories and statistics come together.
Up-to-date platforms are built to hook audiences. Personal stories lend themselves well to this context because they invite reactions, comments, and sharing.
Explain in a short video clip what you were not expecting to happen, rather than giving probability explanations. This isn’t an indication that the story is more informative. It makes the story easier to digest and more emotionally satisfying.
The dopamine reinforcement system created when content appears as a notification, response, and reward can create a reinforcing cycle that leads to reengagement. Content that appears as a notification, response, and reward can trigger a dopamine feedback loop that leads to reengagement. Users can scroll and keep going down for the next interesting example, and slowly they’ll develop a sense of the cases, not based on representative data.
For instance, discussing IVIBET Portugal content can help highlight the difference between individual experience and statistical context without making the conversation about a product. A user account can reflect an individual event, whereas performance indicators or larger data sets can illustrate patterns across multiple events. These are different modes of information, and if readers understand the difference, they will better understand digital information.
Using tools for reading statistics without losing the human story.
The aim is not to overlook personal experiences. Through stories, students learn what numbers mean in the real world. The trick is not to “take an emotionally charged example for a statistical explanation”.
If you are considering taking a great claim, first ask:
- What is the numeration mentioned in the statistic referring to?
- How large is the sample?
- Is the personal storyline typical or unusual?
- Are there indications that there is a correlation or causation?
- What information would the story not include?
Statistics are easier to digest when presented in a good story. The right statistic helps put a story in perspective. They work best when combined: emotion generates interest, and evidence provides context.

Hi, I’m Tony — a passionate blogger with over 3 years of experience in writing informative and accurate content. I specialize in sharing practical insights on sizes, measurements, and spatial guides to help readers make confident decisions. Through DimensionsPoint.com, I aim to simplify complex data into easy-to-understand content that’s reliable, useful, and SEO-friendly.
When I’m not writing, I’m researching the latest trends in measurement standards and user needs to keep my content relevant and up to date.